"Good luck."
That was the closing guidance after a brainstorming session with senior security leaders at a global insurance enterprise. The ask sounded simple: deliver a board-ready cybersecurity dashboard. The reality was unclear definitions, high-visibility stakeholders, and one chance to establish confidence.
Cybersecurity Risk Dashboard
Pressure Context
The project had high profile executive attention and no room for a weak first impression. The program started in August, but the dashboard narrative was still unsettled deep into the engagement.
Data lived across 16 systems with inconsistent definitions and uneven quality. The pressure was not only technical; it was organizational and reputational.
My leadership focus was clear: build shared understanding first, then deliver a finished story that executives could trust immediately.
What I Chose and Why
Protect credibility before the reveal
I delayed the first flagship dashboard demo until we had strong alignment on metric definitions, audience expectations, and visual narrative.
High-profile executives make fast judgments. A half-formed dashboard would have created doubt that was hard to reverse.
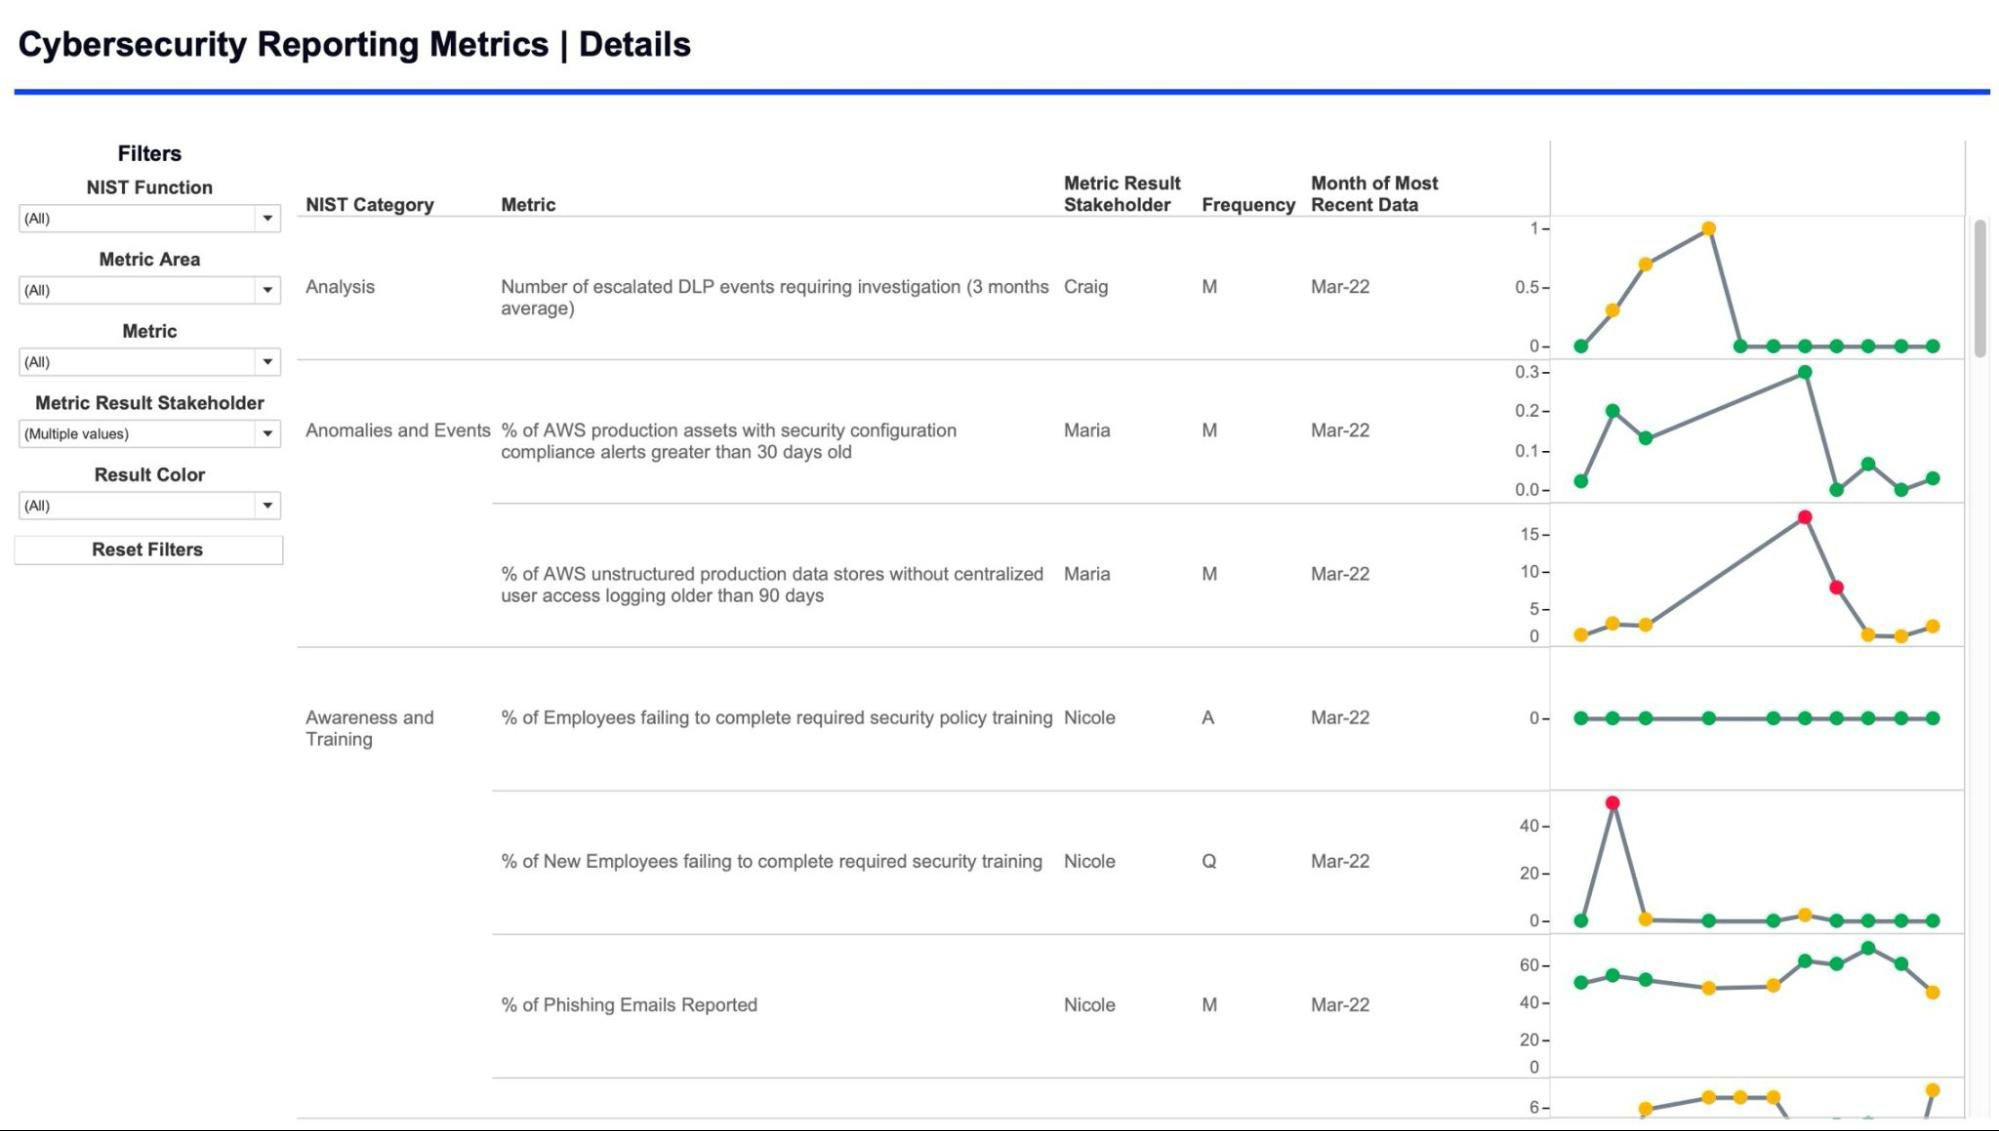
Make the index transparent, not mysterious
I implemented a simple weighted average at the NIST subcategory level, then paired it with visual drill-down so leaders could see how each component contributed.
A board score only works if people trust how it is calculated. Transparency protected trust and prevented misleading rollups.
Deliver in layers under pressure
I released focused slices for learning and alignment, while safeguarding the final board-ready dashboard as a polished, high-confidence release.
This approach let stakeholders shape direction without framing unfinished drafts as the final product.
Delivery Strategy Timeline
August to December
Alignment before exposure
The team faced pressure to show "the dashboard" early. I prioritized metric definition, ownership clarity, and narrative alignment before committing to a flagship reveal.
During discovery
Guarded progress demos
I shared targeted intermediate views with clear framing: useful progress, but not the finished executive artifact. This preserved momentum without sacrificing trust.
Late January reveal
Board-ready launch moment
With shared understanding in place, the final dashboard came together quickly and landed strongly in the first executive walkthrough.
Product Reveal Gallery
Executive Reaction Wall
"I think this is awesome."
VP, Governance and Security
"I am blown away."
CISO
"Love the landing page."
IT Leadership
"You absolutely crushed it on the security dashboard project. To build a board-level presentation in two weeks is no small feat."
Senior Delivery Principal
Contrast Proof: Clarity Under Pressure
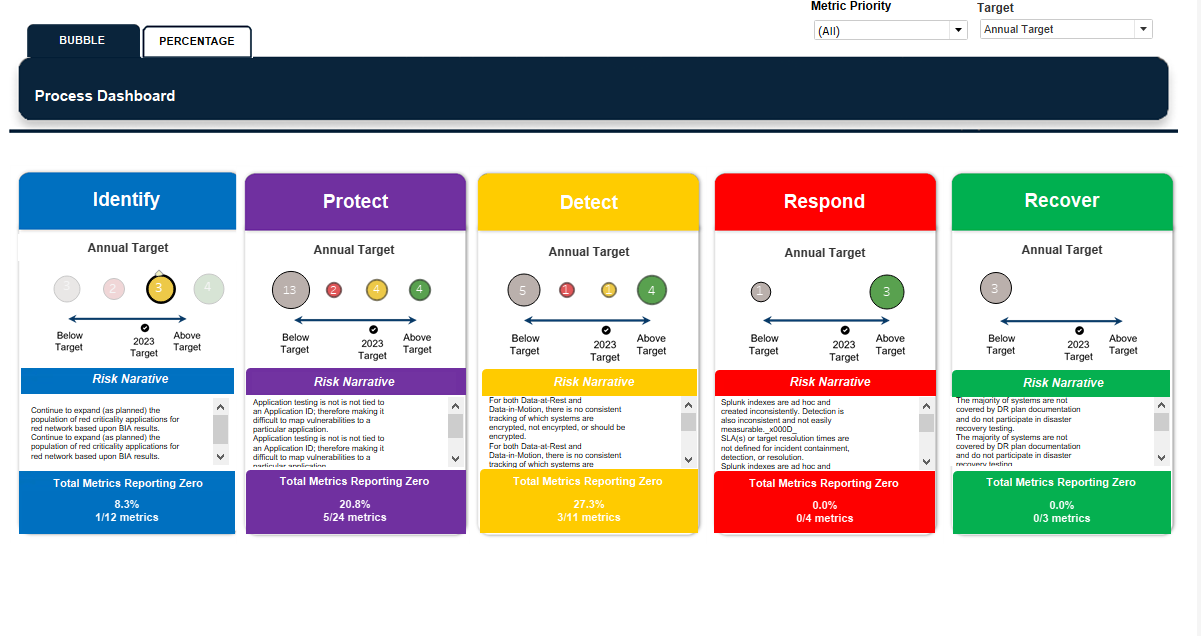
This comparison is not about criticizing another team. It is evidence of delivery strategy. My approach optimized for executive comprehension under time pressure.
The design intentionally balanced summary and traceability so leaders could make decisions quickly without losing confidence in the underlying detail.
In board contexts, visual clarity is a risk control. Better readability leads to better decisions.
Outcomes and Leadership Takeaways
23
Metrics launched
20
Alteryx workflows engineered
17
Tableau dashboards delivered
16
Unique source systems integrated
~$15B
Enterprise scale context
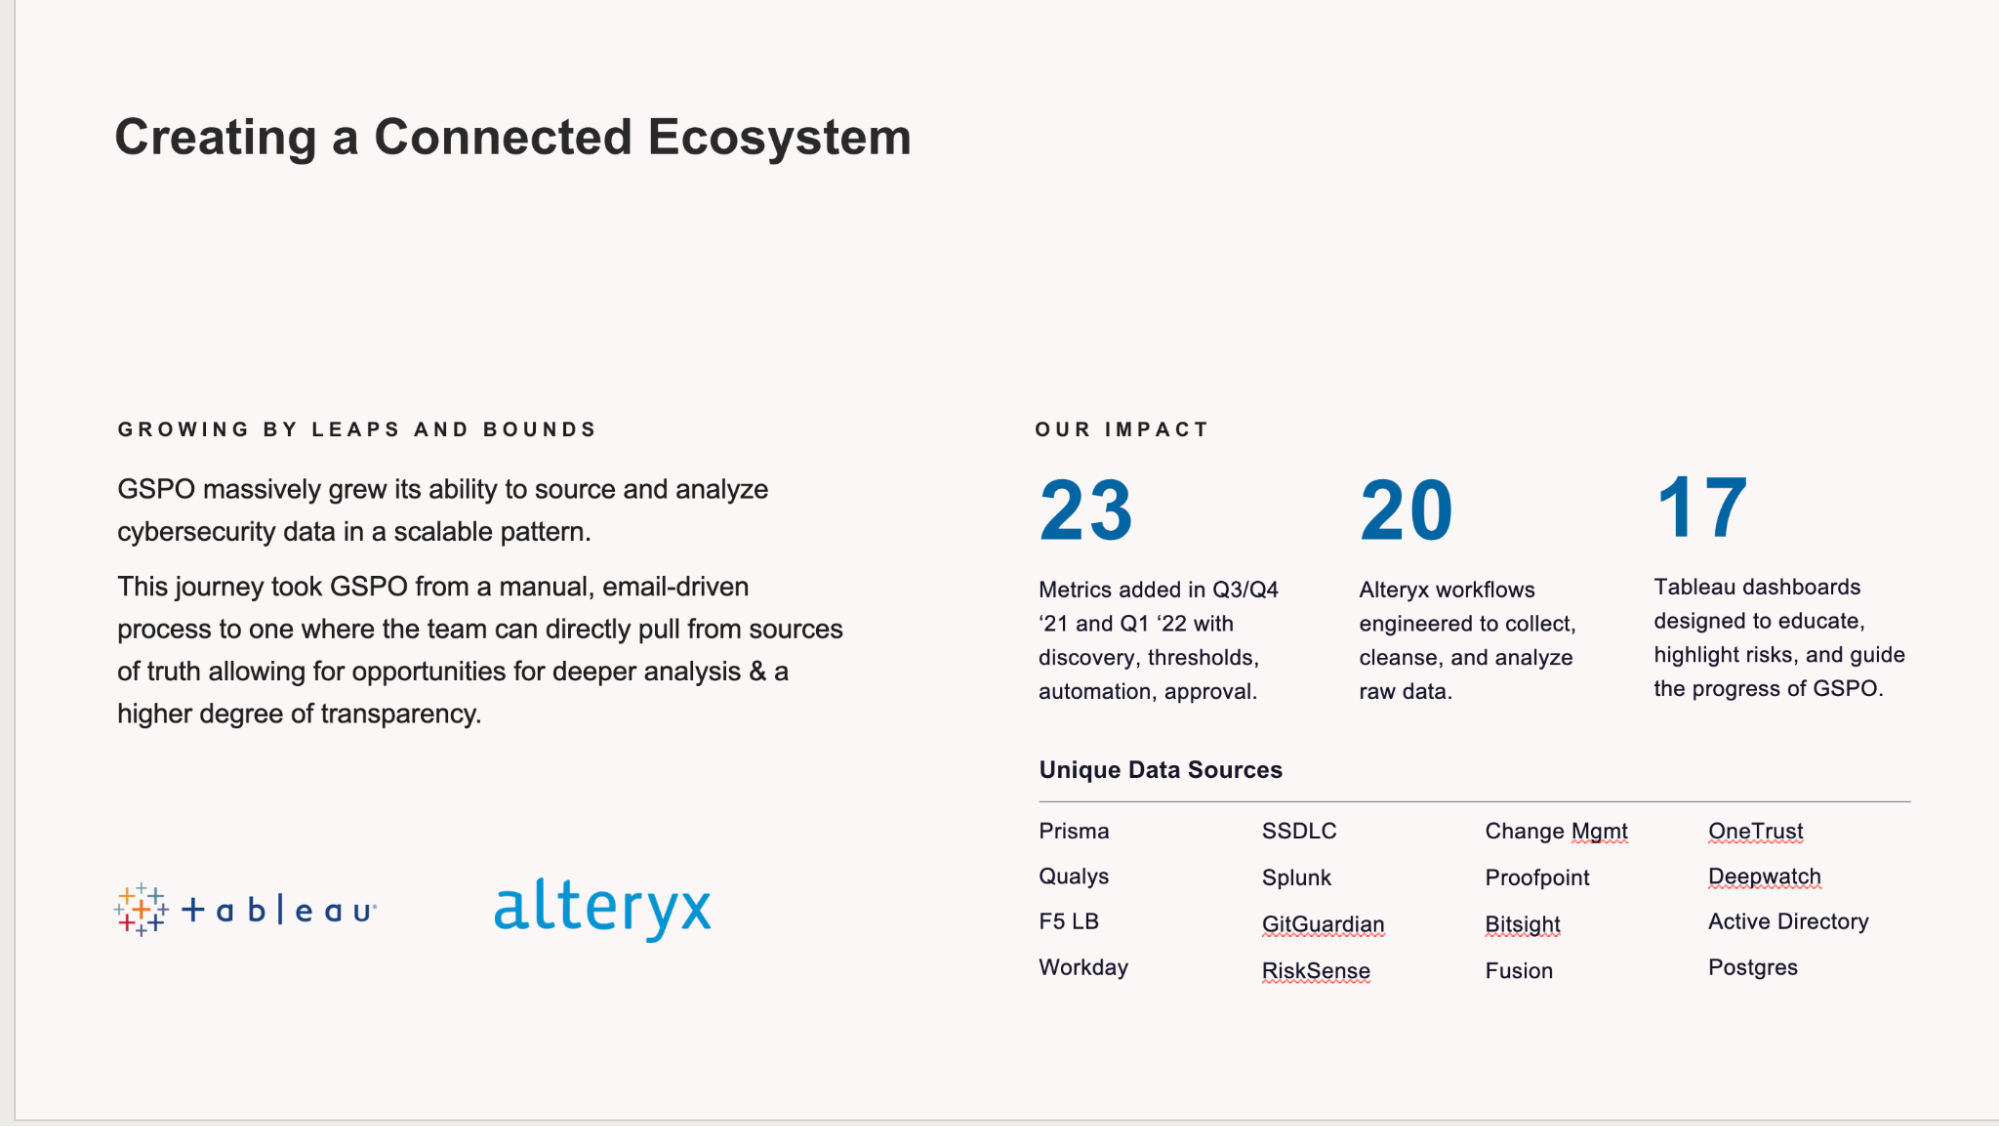
What changed for the organization
- Moved from manual, email-driven reporting to scalable source-of-truth analytics.
- Established a trusted board narrative for cybersecurity posture and movement over time.
- Created a foundation that supported project extension and expansion after handoff.
What this says about how I lead
- I protect executive trust by sequencing delivery for confidence, not optics.
- I simplify high-stakes decisions without hiding the underlying mechanics.
- I translate ambiguity into clear action, then execute fast when alignment is real.
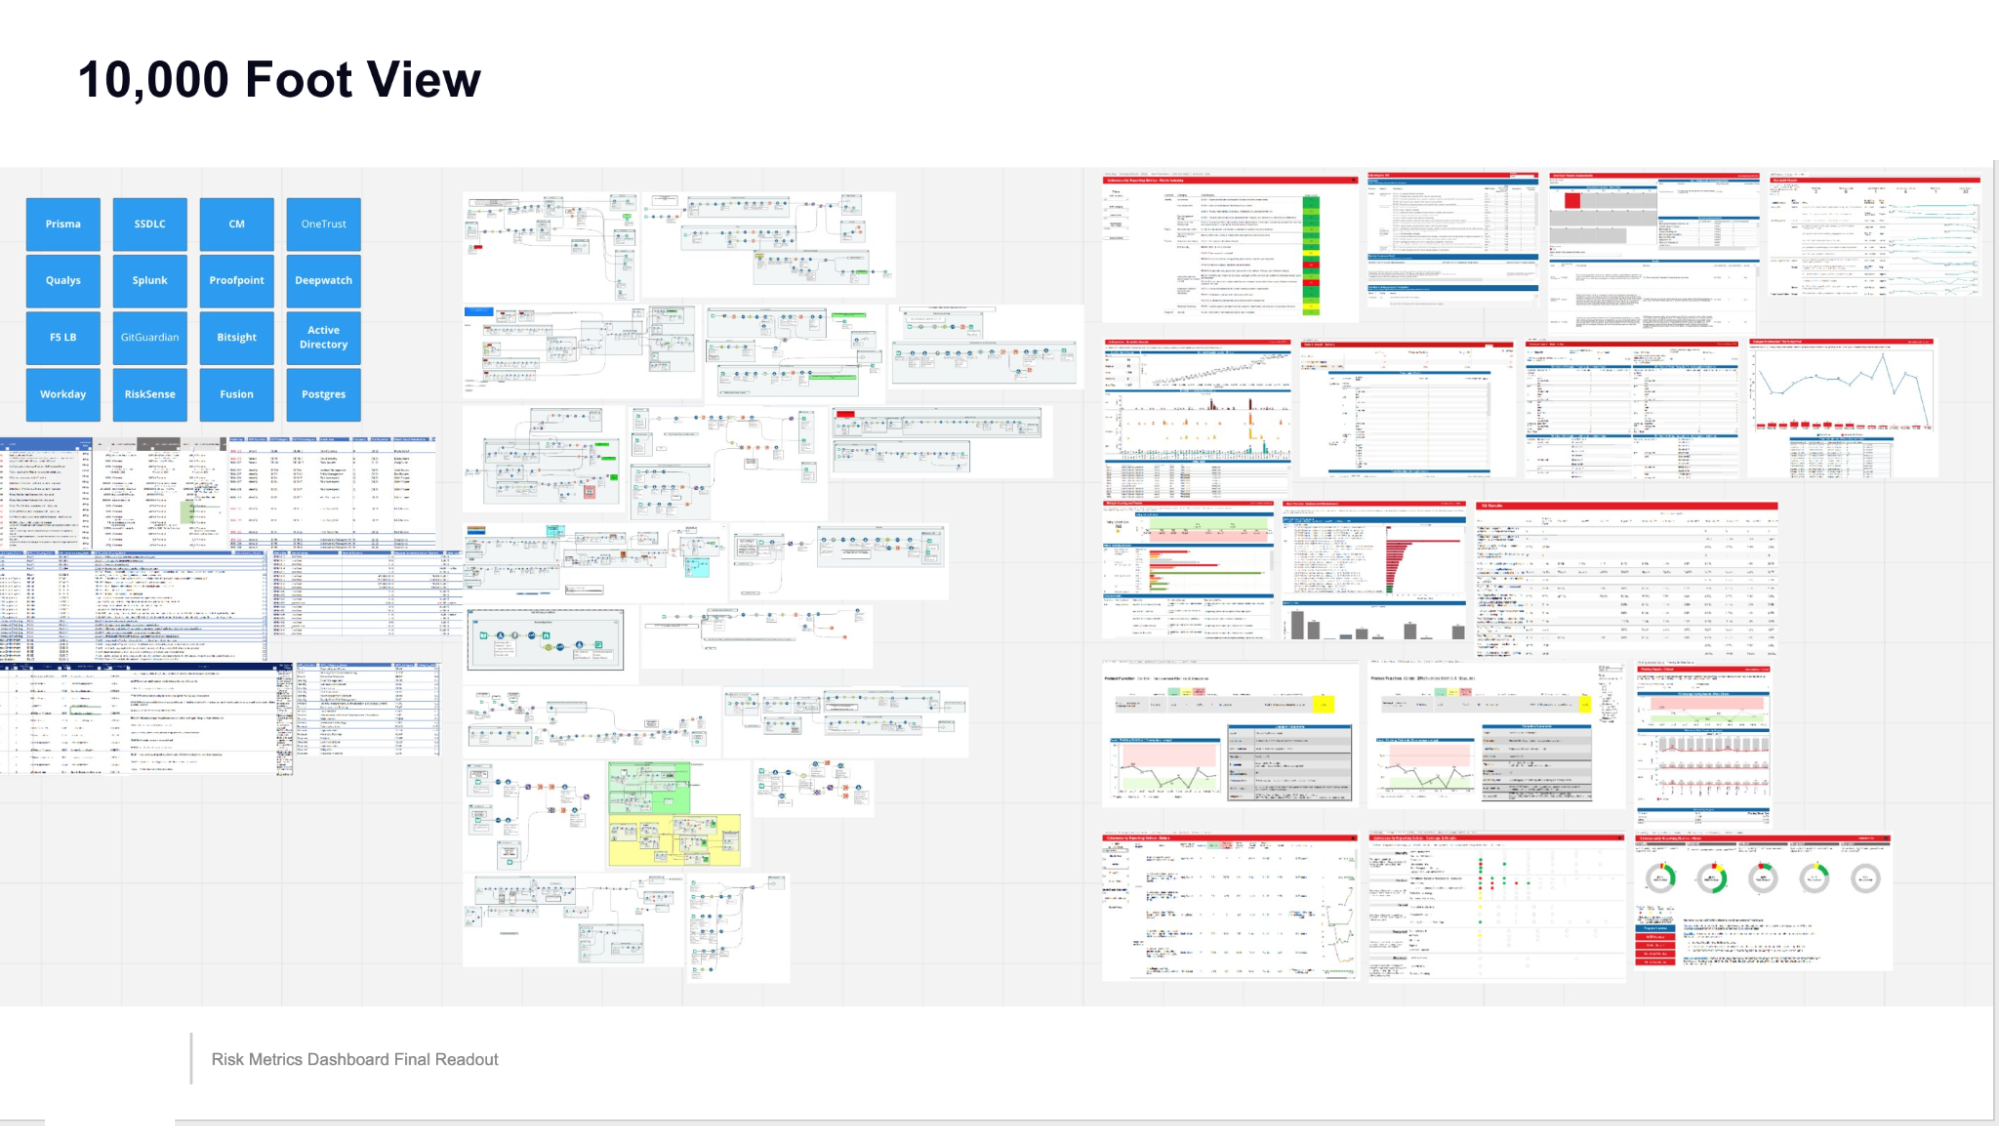
Technical Footprint
16 integrated sources including SIEM, IAM, endpoint, vulnerability, and governance platforms; 20 Alteryx workflows; 17 Tableau dashboards; and an index model designed for transparent executive decision support.